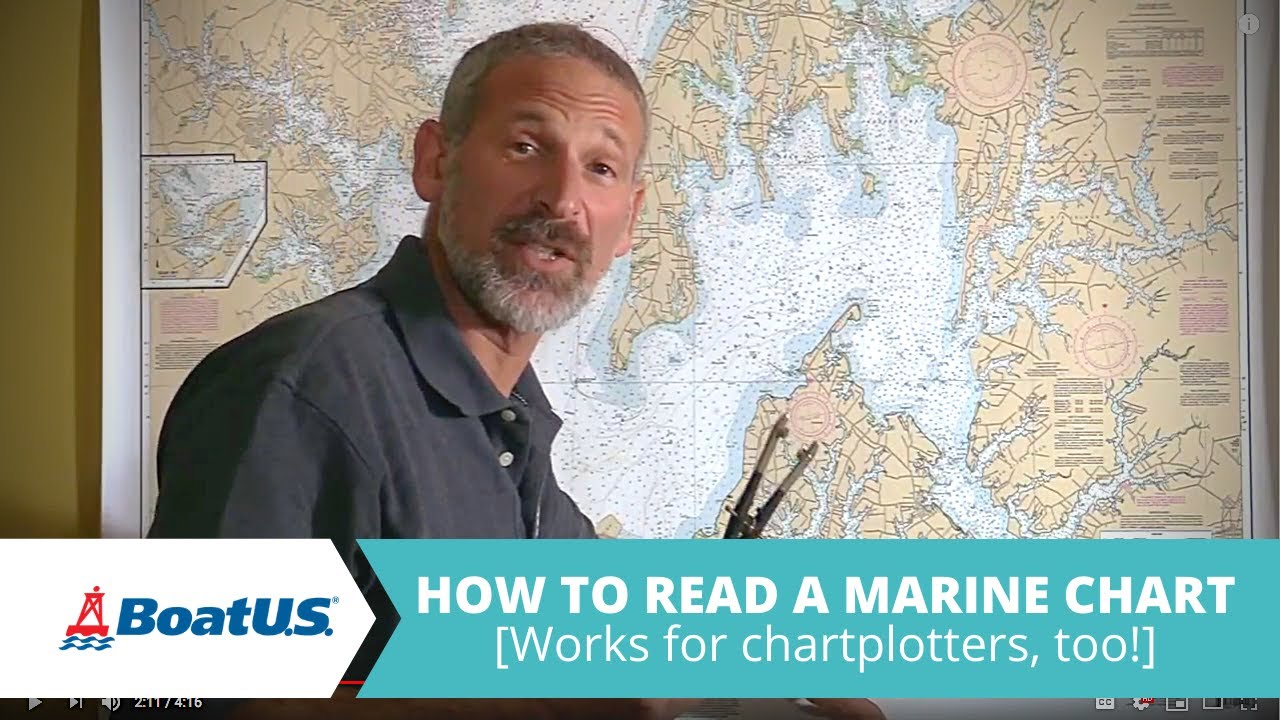
Knowing how to read nautical charts is one of those skills that separates confident boaters from nervous ones. Whether you’re renting a pontoon to explore Crab Island or heading out into the Gulf of Mexico off Destin, a nautical chart tells you what’s beneath the surface, shallow sandbars, channels, obstructions, and safe passages, before your hull finds out the hard way.
At Original Crab Island, we put guests on the water every day for pontoon cruises, fishing charters, and jet ski adventures around the Emerald Coast. We see firsthand how much more comfortable people feel once they understand the basics of chart reading. You don’t need to be a licensed captain to benefit from this knowledge. Even a casual renter or first-time boater gains a real edge by recognizing depth soundings, buoy symbols, and the color-coded shading that marks safe water from danger zones. It’s practical knowledge that keeps you and your passengers safer.
This guide breaks down the core elements of a nautical chart, symbols, depth markings, colors, and navigational aids, in plain language. By the end, you’ll be able to pick up any chart and actually make sense of what you’re looking at, whether you’re planning a route through Destin’s busy harbor or just curious about how marine navigation works.
What a nautical chart shows and why it matters
A nautical chart is a detailed topographic map of the water, designed to give mariners an accurate picture of what lies both above and below the surface. Unlike a road map, a nautical chart layers in water depth, underwater hazards, navigational aids, shoreline features, and regulated zones, all on a single document. Think of it as a complete snapshot of a body of water that helps you plan where to go, what to avoid, and how to get back safely.
The information a chart packs in
Every chart packs in far more detail than most people expect when they first pick one up. NOAA (the National Oceanic and Atmospheric Administration) produces the official nautical charts used throughout U.S. waters, and each chart covers a specific geographic area at a defined scale. On a single chart of Destin Harbor and the surrounding Gulf waters, for example, you’ll find depth soundings scattered across the water area, which are numbers indicating how deep the water is at each location. You’ll also see contour lines connecting equal depths, color-coded shading that marks shallow zones versus safe water, and symbols for buoys, lighthouses, anchorages, restricted areas, and submerged obstructions like rocks or wrecks.
Charts also include a compass rose printed directly on the sheet, which lets you measure bearings and plot headings without any extra tools. Tide reference data and scale bars appear in the margins. Once you understand how to read nautical charts, you realize the chart is doing a huge amount of work for you before you ever start the engine.
A nautical chart is not a suggestion. It is your primary tool for knowing what the water is hiding beneath a flat, featureless surface.
Why charts matter more than GPS alone
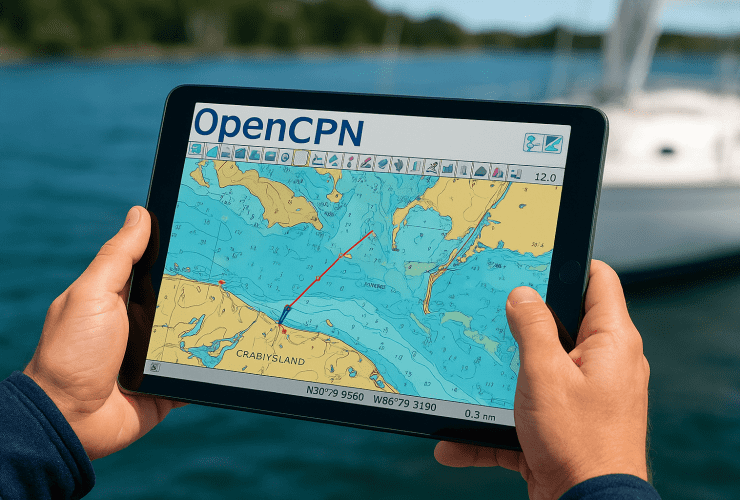
Many boaters today rely entirely on GPS chartplotters, and while those tools are useful, they carry a real risk: your GPS device is only as accurate and current as the data loaded into it. NOAA updates charts regularly as conditions change, new wrecks are discovered, and sandbars shift. If your chartplotter runs outdated data, it may show clear, deep water where a sandbar has built up over the past season, and coastal areas like Destin see significant sandbar movement from storm activity and tidal patterns year-round.
Reviewing an actual paper or digital nautical chart gives you a second layer of verification. It forces you to engage with the information actively, spot inconsistencies, and cross-check your planned route before you leave the dock. Experienced mariners treat their charts and GPS as a team, not a hierarchy. One confirms the other. Build the habit of checking your chart before every trip and you develop situational awareness that no screen can fully replace on its own.
Before you start: key terms, tools, and safety
Before you dive into how to read nautical charts, you need a baseline vocabulary and a short list of practical tools. Walking up to a chart cold, without knowing what "datum" or "fathom" means, turns a useful document into a confusing wall of numbers and abbreviations. A few minutes of preparation here will make every section that follows much clearer and far more actionable.
Key terms every chart reader should know
Nautical charts come with their own language, and a handful of core terms appear constantly regardless of the water body or chart scale you are using. Knowing these upfront saves you from pausing mid-plan to look things up.
| Term | Definition |
|---|---|
| Datum | The reference baseline for all depth measurements. Most U.S. charts use Mean Lower Low Water (MLLW), so charted depths reflect the lowest typical tide. |
| Fathom | A unit of depth equal to 6 feet. Older charts use fathoms; modern NOAA charts typically show feet or meters. |
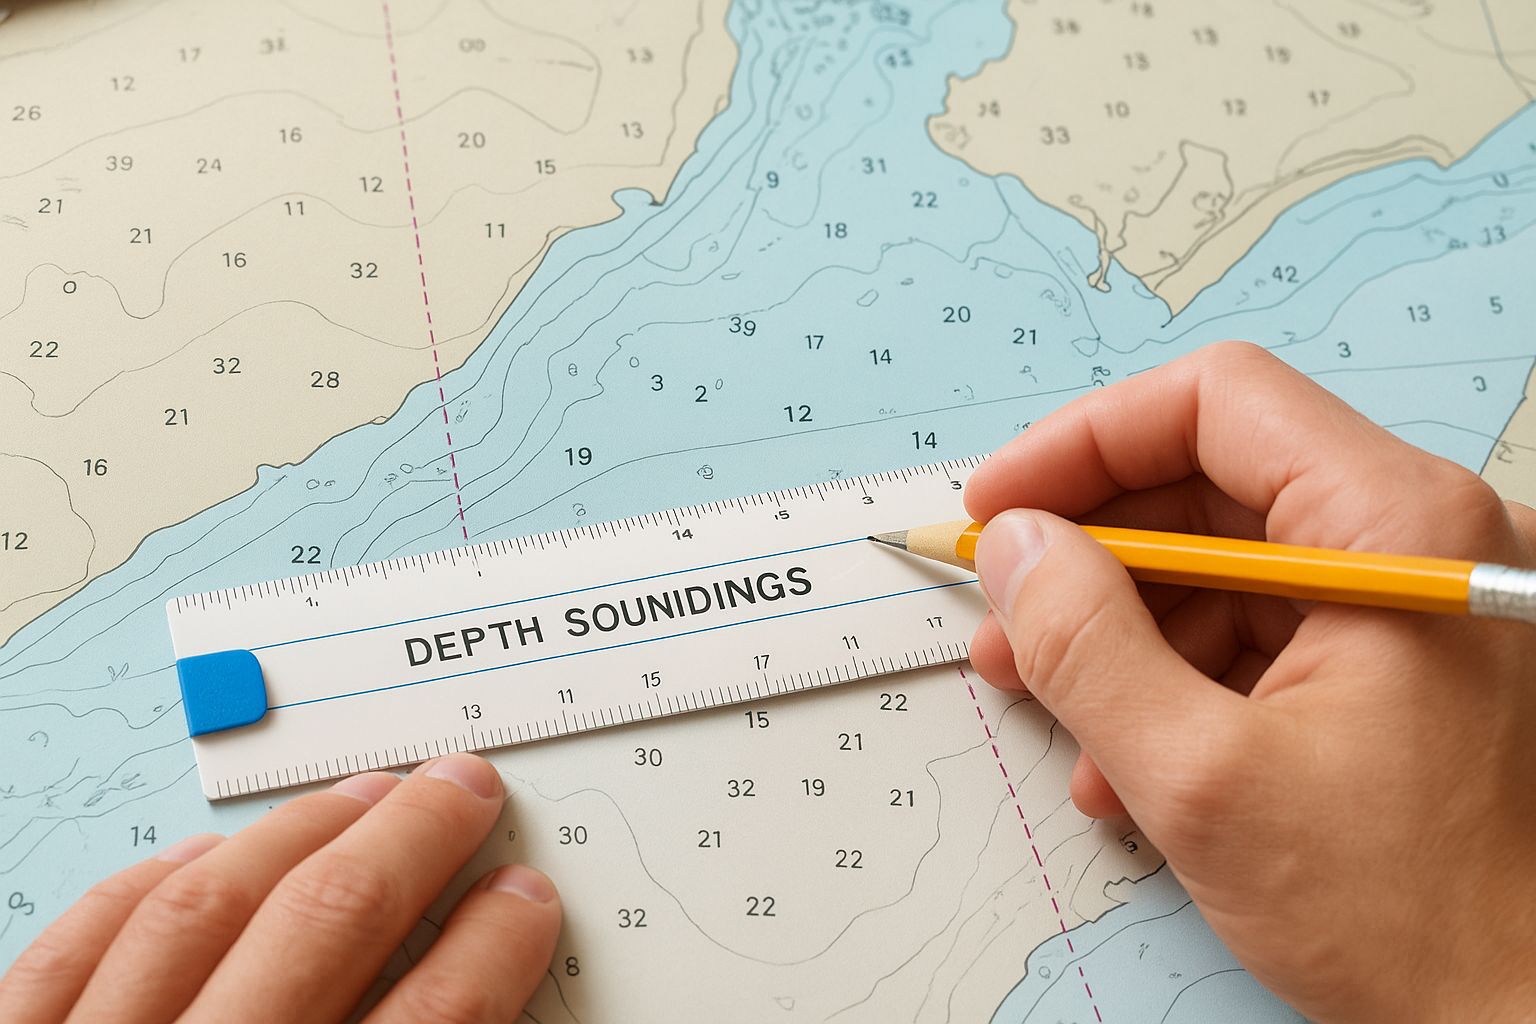
| Sounding | A single depth measurement printed at a specific location on the chart. |
| Bearing | Direction of travel measured in degrees from north, either true or magnetic. |
| Contour line | A line connecting points of equal depth, similar to elevation lines on a topographic land map. |
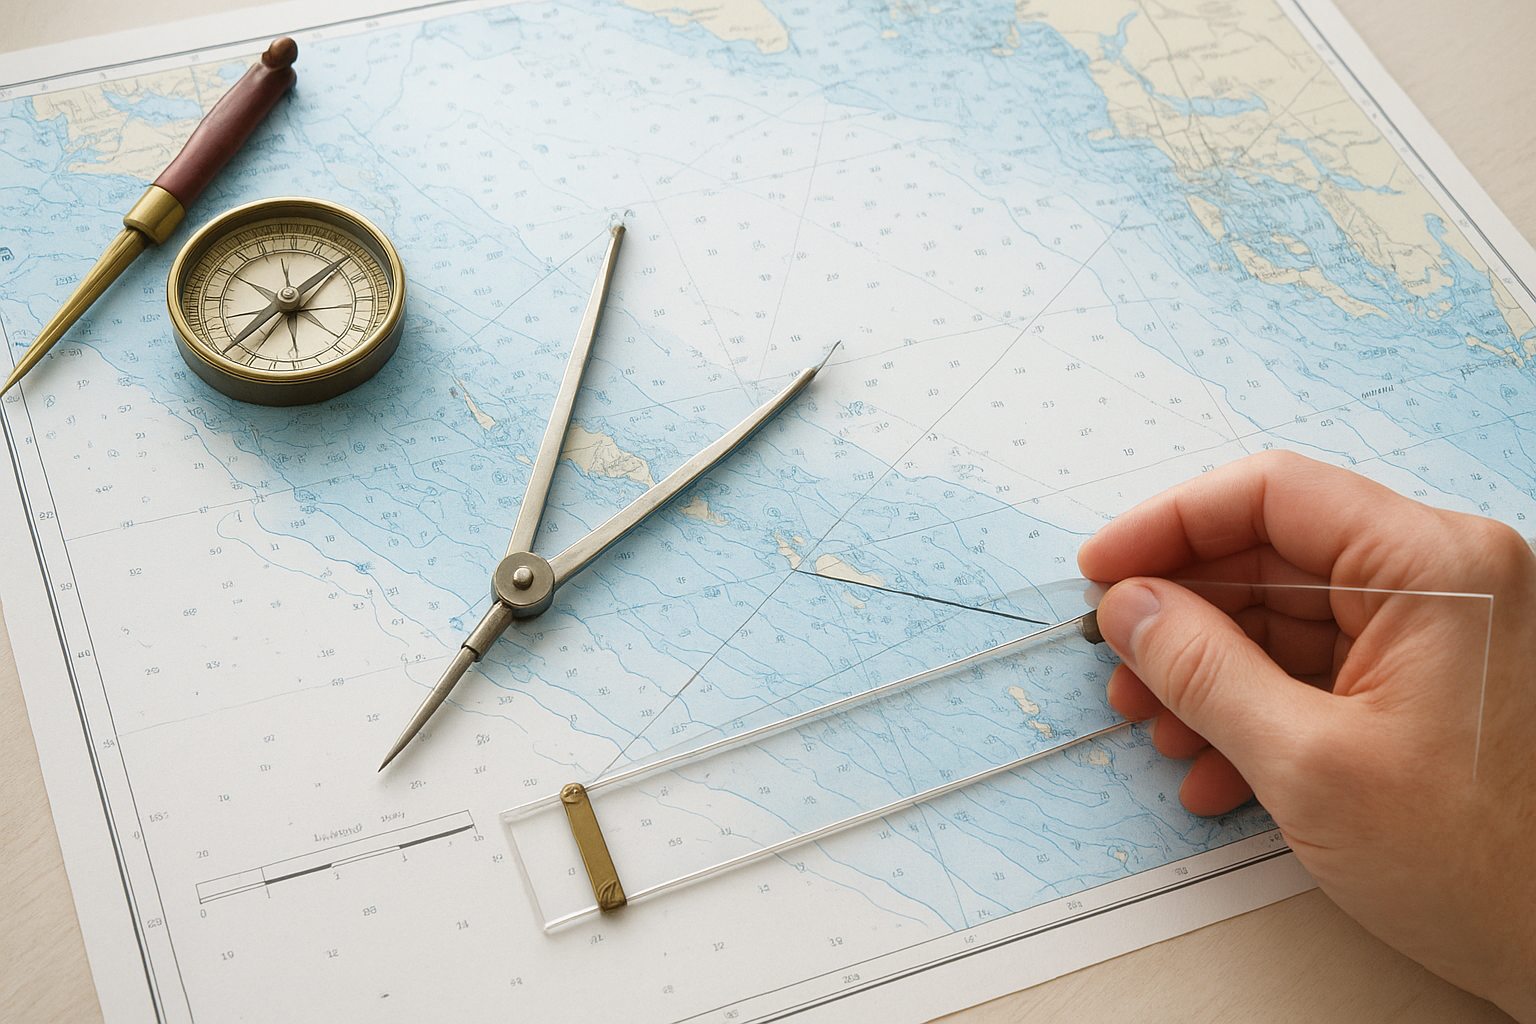
Tools to have on hand and one firm safety rule
You only need a small set of tools to work with a nautical chart effectively. Grab a waterproof printed chart or a tablet loaded with a current chart file, a parallel ruler or course plotter for measuring bearings, and a pair of dividers for scaling distances. NOAA provides free, downloadable charts directly at nauticalcharts.noaa.gov, so there is no excuse for navigating on outdated data.
Always confirm you are working from the most current chart edition before leaving the dock, because sandbars, wrecks, and channel markers shift more than most boaters expect.
Safety comes down to one non-negotiable habit: cross-check your planned route on the chart before you start the engine. Mark any shallow areas, note restricted zones, and share the basics of the plan with your passengers so everyone on board knows what to expect.
Step 1. Get oriented with scale, north, and bearings
Before you interpret a single depth number or symbol, you need to understand where you are on the chart and what scale you are working with. Skipping this step is like opening a road map and ignoring the legend, you will misread distances, miss hazards, and plot routes that do not match reality. This is where learning how to read nautical charts actually begins.
Understanding chart scale
Chart scale describes how much the real world has been compressed to fit on the page. A scale of 1:80,000 means one inch on the chart equals 80,000 inches, or roughly 1.1 nautical miles, in the real world. Large-scale charts (like 1:10,000) show a small area in high detail, which is exactly what you want when navigating a busy harbor like Destin’s. Small-scale charts (like 1:1,000,000) cover wide ocean areas but show far less detail. Always match your chart scale to your activity. Use a large-scale chart for inshore and harbor navigation, and a small-scale chart only for broad passage planning.
Always double-check your chart scale before measuring any distance, because a misread scale multiplies every routing error across your entire trip.
A quick practical check: find the scale bar printed in the chart’s margin, place your dividers against it, and use that calibrated span to measure distances on the chart itself. This takes about 30 seconds and eliminates guesswork.
Finding north and plotting bearings
Every NOAA chart prints a compass rose somewhere on the face of the chart. The compass rose has two concentric rings. The outer ring shows true north, aligned with geographic north. The inner ring shows magnetic north, adjusted for local variation. Use true north for GPS-based navigation and magnetic north when working with a handheld compass.
To plot a bearing, lay a parallel ruler or course plotter across the two points you want to connect, then walk or roll the ruler to the nearest compass rose. Read off the degree where your line intersects the ring you need, true or magnetic, and write that number down before you move anything.
Step 2. Read depth soundings, contours, and tide datums
Depth data is the heart of any nautical chart, and once you can read it fluently, you can spot a dangerous sandbar or a safe anchorage in seconds. Depth soundings, contour lines, and tide datums work together to give you a three-dimensional picture of what lies beneath a flat, featureless water surface. Read them as a system, not as isolated data points.
How depth soundings work
Soundings are the numbers scattered across the water area of a chart, and each one shows a measured depth at that exact location. On modern NOAA charts of U.S. coastal waters, those numbers appear in feet or meters depending on the chart edition. Always check the chart’s title block to confirm which unit applies before you read a single number.
Use this process every time you check soundings along a planned route:
- Locate the sounding closest to your intended path
- Note the current tidal stage (rising, falling, high, low) for your departure time
- Subtract any tidal height reduction from the charted depth to find your worst-case scenario
- Compare that result against your vessel’s draft, and add at least a 2-foot safety buffer
- Reroute immediately if the margin is too thin
Never treat a sounding as permanent. NOAA updates charts as sandbars shift and new obstructions are recorded, so pull the latest edition before every trip.
Contour lines and tide datums
Depth contour lines connect points of equal depth across the chart, functioning exactly like elevation lines on a topographic land map. Tightly spaced contours mean a steep drop; widely spaced contours indicate a gradual slope. Along the Emerald Coast, this distinction matters because shallow sandbars sit immediately adjacent to deeper channels, and a misread contour can put your hull on the bottom.
Tide datums set the reference point for every sounding on the chart. U.S. charts use Mean Lower Low Water (MLLW), which means charted depths reflect the lowest typical tidal condition. At high tide, actual depth will exceed the printed sounding. Knowing how to read nautical charts means you factor tidal conditions into your depth calculations before departure, every single time, without exception.
Step 3. Decode colors, symbols, lights, and abbreviations
Colors, symbols, and abbreviations form the visual language of every nautical chart, and fluency here is what separates a slow, uncertain reader from someone who can scan a chart and spot hazards in seconds. When you understand how to read nautical charts at this level, you move from decoding isolated numbers to reading the entire water environment as one coherent picture before you ever leave the dock.
Chart colors and what they tell you
NOAA prints nautical charts using a consistent color scheme tied directly to water depth and shoreline conditions. Memorize these four core colors and you can identify risk zones instantly without reading a single sounding number.
| Color | What it represents |
|---|---|
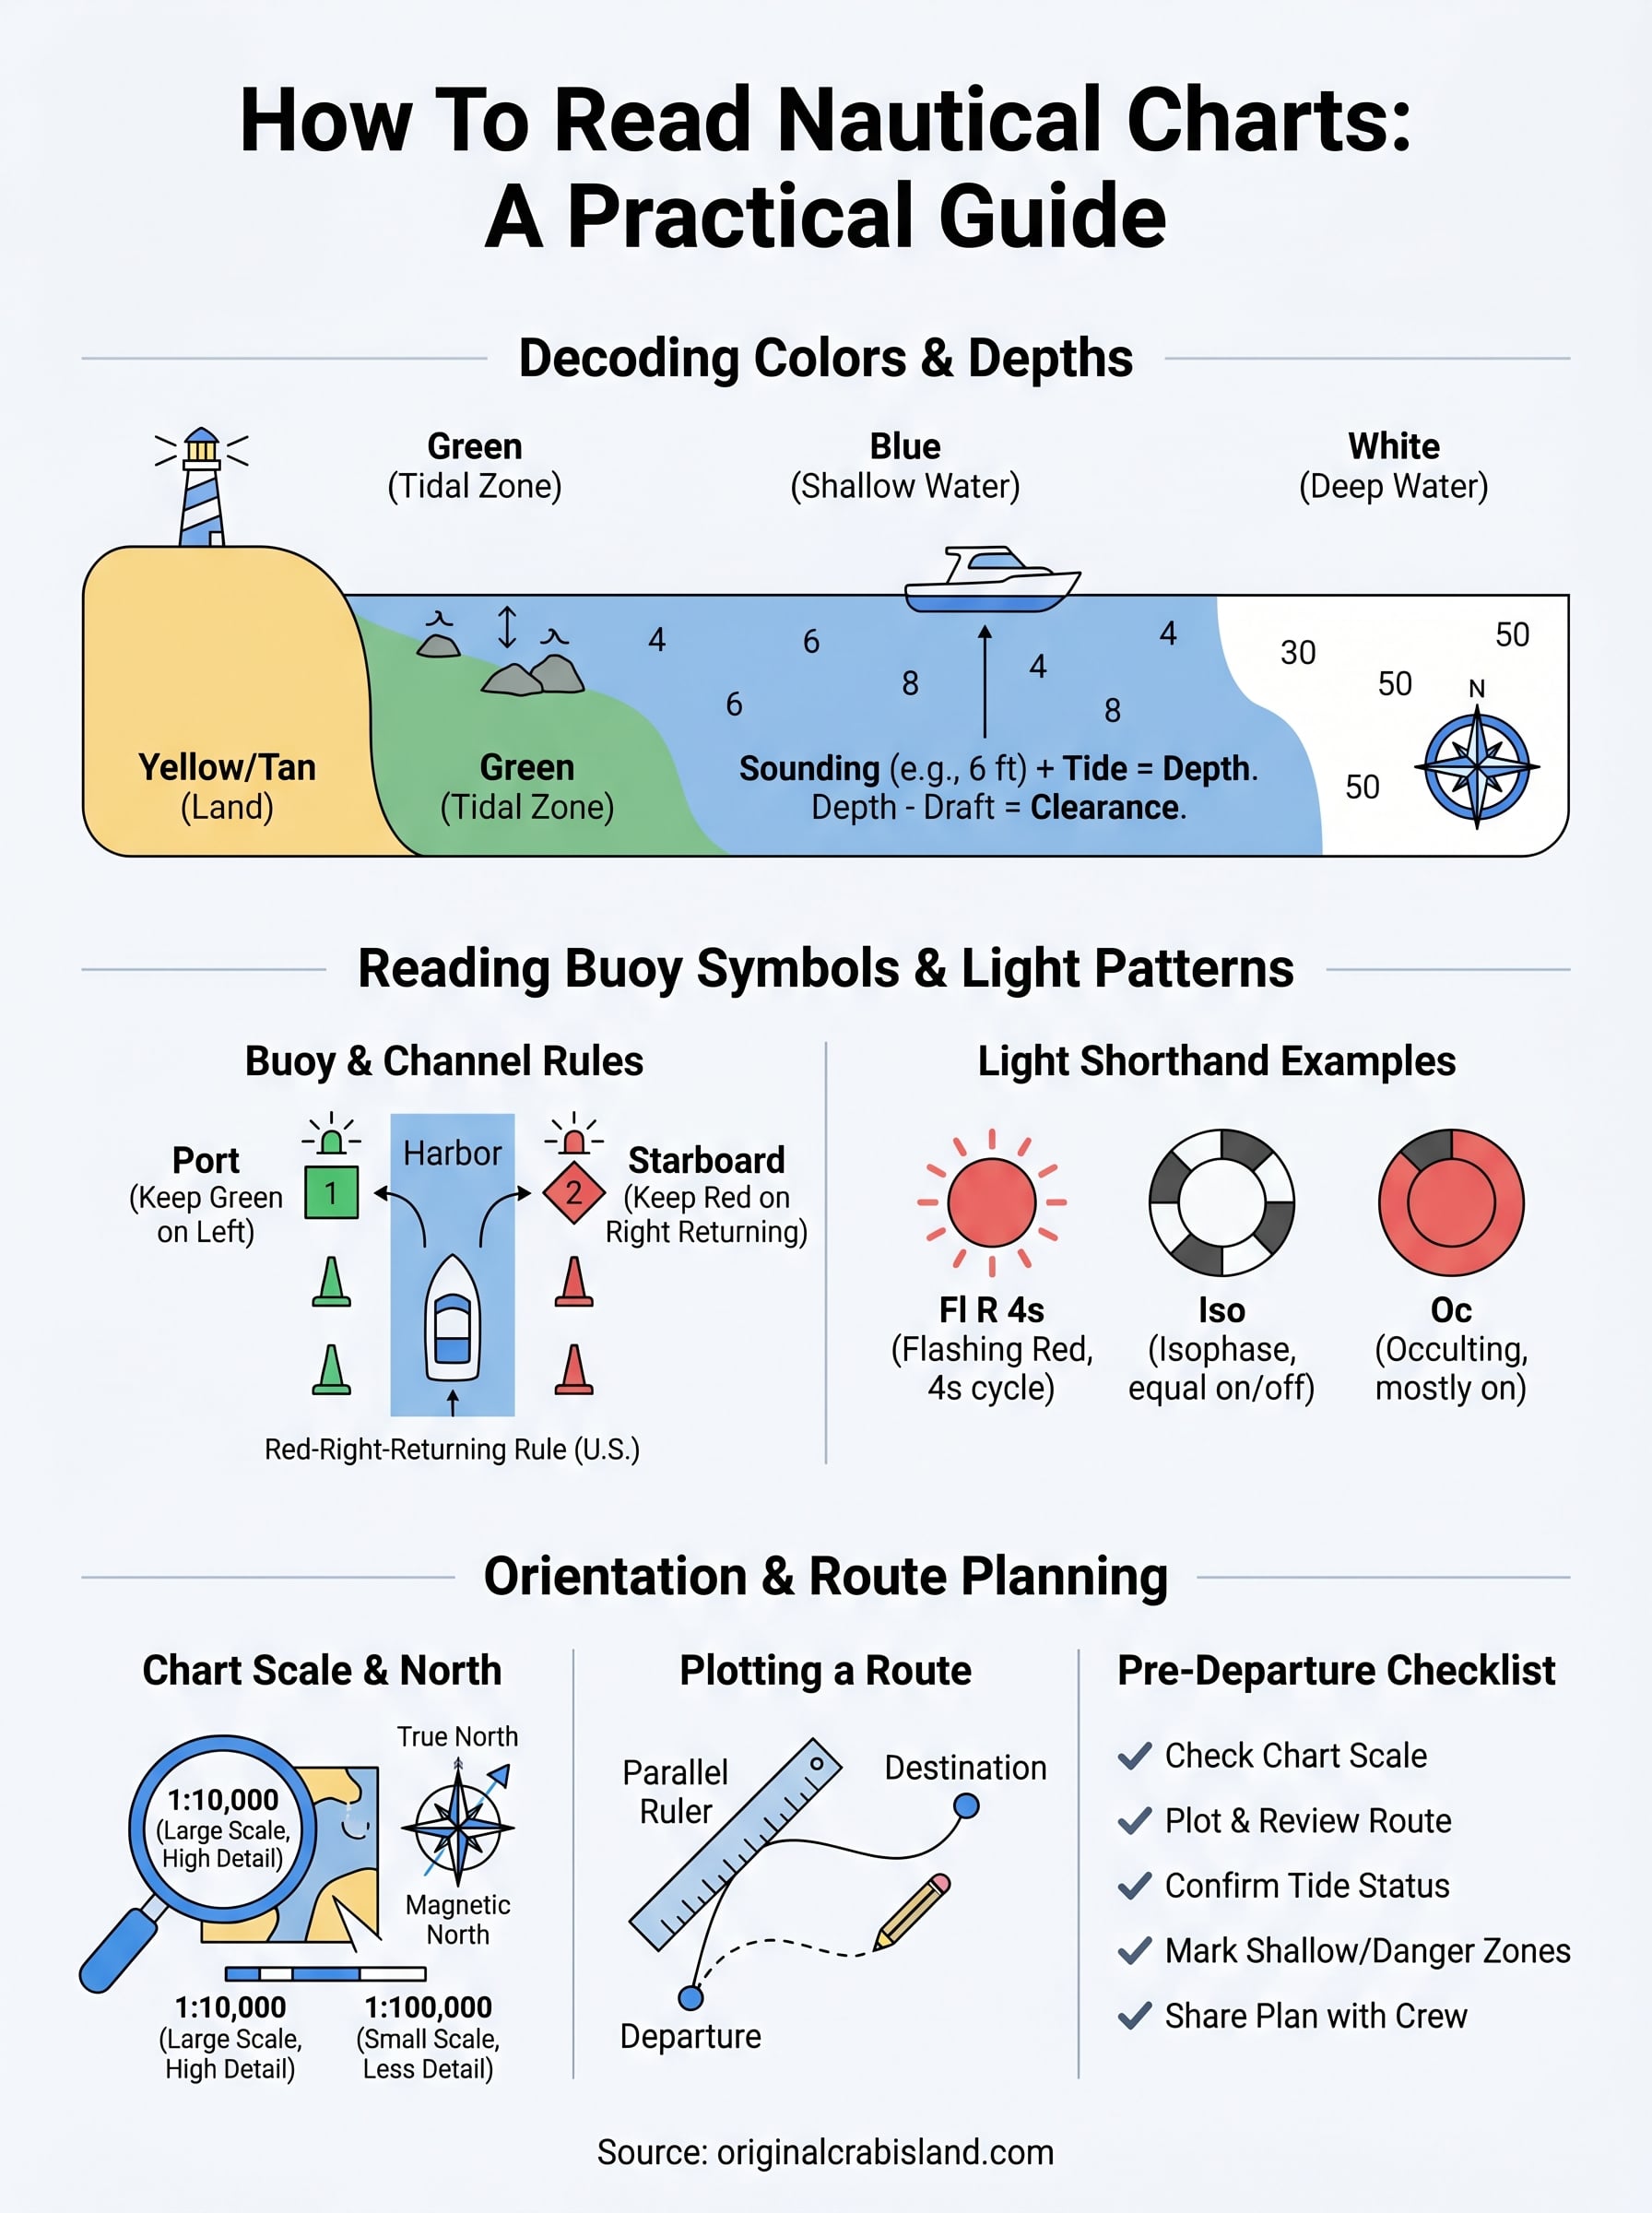
| White | Deep, generally safe navigational water |
| Blue | Shallow water; check soundings and tidal stage carefully |
| Green | Intertidal zones exposed at low tide |
| Yellow/Tan | Dry land above the high-water mark |
Blue zones demand the most caution because actual depth shifts significantly with tidal stage, particularly in coastal areas like Destin where sandbars build and erode throughout the season.
Buoy symbols and light characteristics
Buoy symbols appear as small diamonds or circles pinned to specific positions on the chart, and each carries a label describing color, shape, and light pattern. A red buoy marked "2" with a flashing light notation means you keep it on your starboard side when returning from open water, following the standard red-right-returning rule that applies throughout U.S. waters.
Lights use a shorthand abbreviation system printed directly on the chart face. "Fl R 4s" means a flashing red light with a 4-second cycle. "Iso" indicates isophase timing, equal periods of light and dark. "Oc" means occulting, where the light stays on longer than it goes off. NOAA publishes a free reference document called Chart No. 1 that defines every symbol and abbreviation used on U.S. nautical charts. Download it directly from nauticalcharts.noaa.gov and keep a copy on board so you can verify any unfamiliar marking during a trip rather than guessing.
Putting it all together before you leave the dock
Now you have the full toolkit for how to read nautical charts: scale and orientation, depth soundings and tide datums, color coding, symbols, lights, and abbreviations. Pull your chart before every trip, plot your route, check the blue zones against your departure tide tables, and verify every buoy and light symbol along your planned path. This ten-minute pre-departure check eliminates most of the surprises that catch unprepared boaters off guard, and it builds the situational awareness that GPS alone cannot give you.
Putting chart knowledge into practice on actual water is what makes it stick. If you want to apply these skills right away on the Emerald Coast, book a pontoon rental or fishing charter at Original Crab Island and bring your chart along for the trip. Crab Island and Destin Harbor give you a real, active environment to read depth contours, spot channel markers, and build genuine on-water confidence before you venture further out into the Gulf.
Popular Crab Island Pages
- Alquiler de pontones en Crab Island
- Chárters de pesca en Crab Island
- Crab Island Boat and Yacht Rentals
- Parapente acuático en Crab Island
- Alquiler de motos acuáticas en Crab Island
- Crab Island Helicopter Rides
- Crab Island Snorkeling Tours
- Crab Island Paddleboard Rentals
- Crab Island Kayak Rentals
- Alquiler de bicicletas en Crab Island
- Crab Island Shark Boat
- Crab Island Pirate Ship
- Crab Island Tiki Rentals
- Crab Island Snorkeling Tours